
Opening the Demo Panel
- Go to Reporting → Analytics & Feedback. The Content tab opens by default.
- Set your date range in the header (defaults to the last 30 days)
- Click any Demo row to open its panel, with Performance and Feedback Submissions tabs
Analytics reflect activity starting March 4, 2026. Earlier data is under Reporting → Legacy Analytics.
Terms used on this page
Terms used on this page
Session: one visit to the Demo, tracked by a session ID. Most Demo metrics are counted or averaged per session.View: a session in which the Demo was started. One visitor starting the same Demo in two separate sessions counts as two views.Unique visitor: a distinct visitor, tracked by a browser-based identifier on the same device and browser. A different device or a private browsing window counts as a separate unique visitor.Return visitor: a visitor who viewed this Demo in more than one session within the date range, counted per content item.Step: a distinct feature-step combination, counted when a viewer lands on it. Revisits don’t count again.Sub-label: the small line of text under each number in the panel.See the Analytics Glossary for every analytics term.
All metrics at a glance
All metrics at a glance
Key Metrics
The six cards at the top of the Performance tab.| Metric | What it shows |
|---|---|
| Total Views | Sessions in which the Demo was started. One visitor in two separate sessions counts as two views. The card also compares this to the equal-length period before your selected range, like ”↓ -12 vs prev period.” |
| Unique Visitors | Distinct visitors who started the Demo. “88% of total” means unique visitors make up 88% of Total Views; the rest are return views. Visitors are tracked by browser, so the same person on another device or in a private window counts again. |
| Avg Time Spent | Average time from when a viewer opens the Demo to their last action, shown as minutes:seconds and in total seconds below it. Daily averages are averaged across your selected range. Sessions where the Demo was opened but nothing else happened count as zero, which pulls the average down. |
| Avg Steps Viewed | Average unique steps viewed per session, out of the Demo’s total, like “4 of 26.” Revisiting a step doesn’t count it again. The “feature progress” percentage below it is Avg Feature Progress. |
| Return Visitors | Visitors who viewed this Demo in more than one session during your selected range. “13% return rate” is the share of Total Views that came from return sessions. Return Visitor Rate under Intent Signals is based on unique visitors instead, so the two percentages won’t match. |
| Viewer Sentiment | A 0–100 satisfaction score from Demo Feedback responses, or Demo Ratings if there aren’t enough responses. It needs at least 5 to show a score. 80–100 Highly positive · 60–79 Positive · 40–59 Mixed · Below 40 Negative |
Demo Depth
How far viewers get through the Demo, where they enter, and where they leave.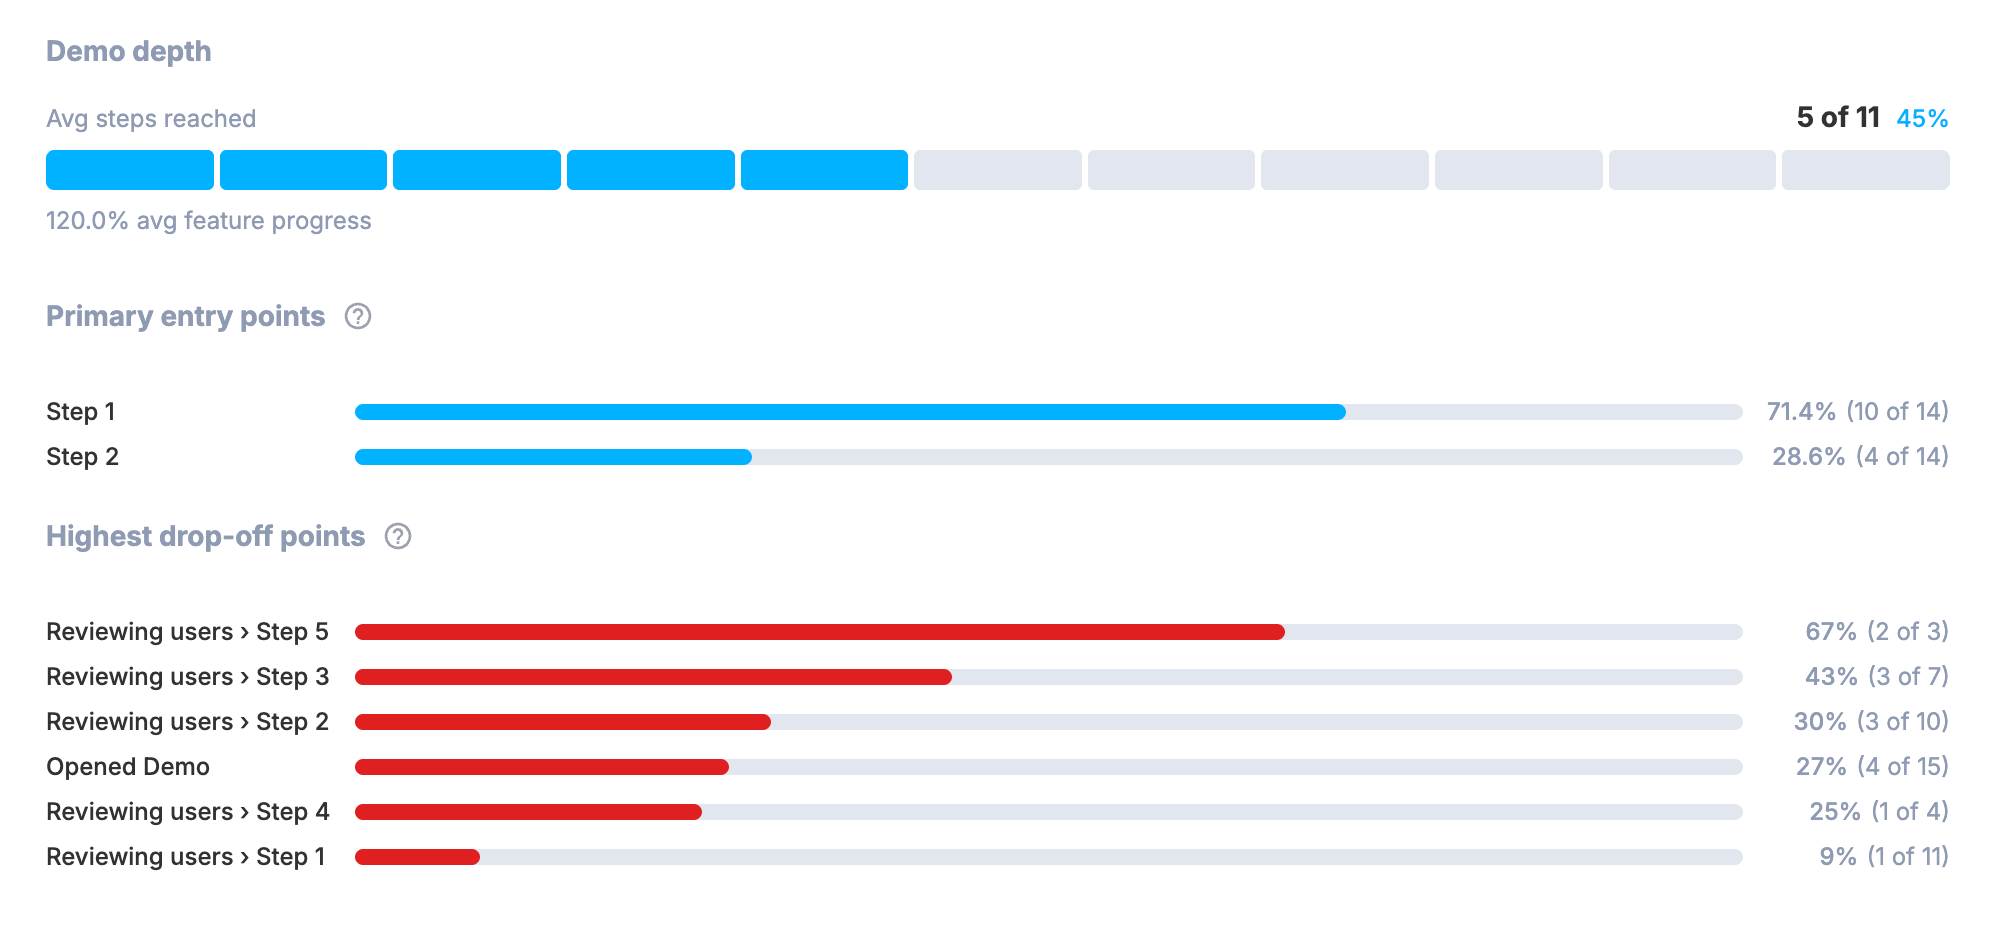
| Metric | What it shows |
|---|---|
| Avg Steps Reached | The same number as Avg Steps Viewed, shown as a bar with one block per step. The percentage beside it, like “15%,” is the share of the Demo’s total steps. A viewer who skipped to the middle and viewed 6 steps counts the same as one who viewed the first 6. |
| Avg Feature Progress | The average percentage of the Demo’s Features reached per session. A Feature counts as reached when the viewer lands on any step in it. In a Demo with 4 Features, a viewer who reached 2 has 50% feature progress. This can be much higher than Avg Steps Reached when Features have very different step counts, like “4 of 26” steps alongside “62.3% avg feature progress.” |
| Primary Entry Points | The share of Demo starts at each step, shown as Feature › Step. Most useful when you deep-link viewers to specific steps. Without deep links, most starts will be at the first step. |
| Highest Drop-off Points | Steps ranked by drop-off rate: the percentage of viewers who reached that step but didn’t continue to the next one. Each percentage is based only on viewers who reached that step, so the list won’t add up to 100%. ”Opened Demo” is the percentage of all sessions where the Demo loaded but the viewer never reached the first step. |
Intent Signals
Behaviors that go beyond viewing the Demo. Coming back or clicking through to more content suggests the viewer is acting on what they saw.Return Visitor Rate
The share of unique visitors who started the Demo in more than one session, like “2 of 6 unique visitors returned.” Both sessions have to fall within your selected range; a return visit outside it doesn’t count. Bot traffic is excluded.This is different from the “return rate” on the Return Visitors card, which is based on Total Views.
Outbound Click Rate
How often viewers click external links inside the Demo. Below it, the panel shows the total clicks and the number of sessions they came from, like “8 clicks across 5 sessions.” The clicks and sessions counts are the most reliable way to read this card.This card only appears after at least one viewer has clicked an external link in your selected range.
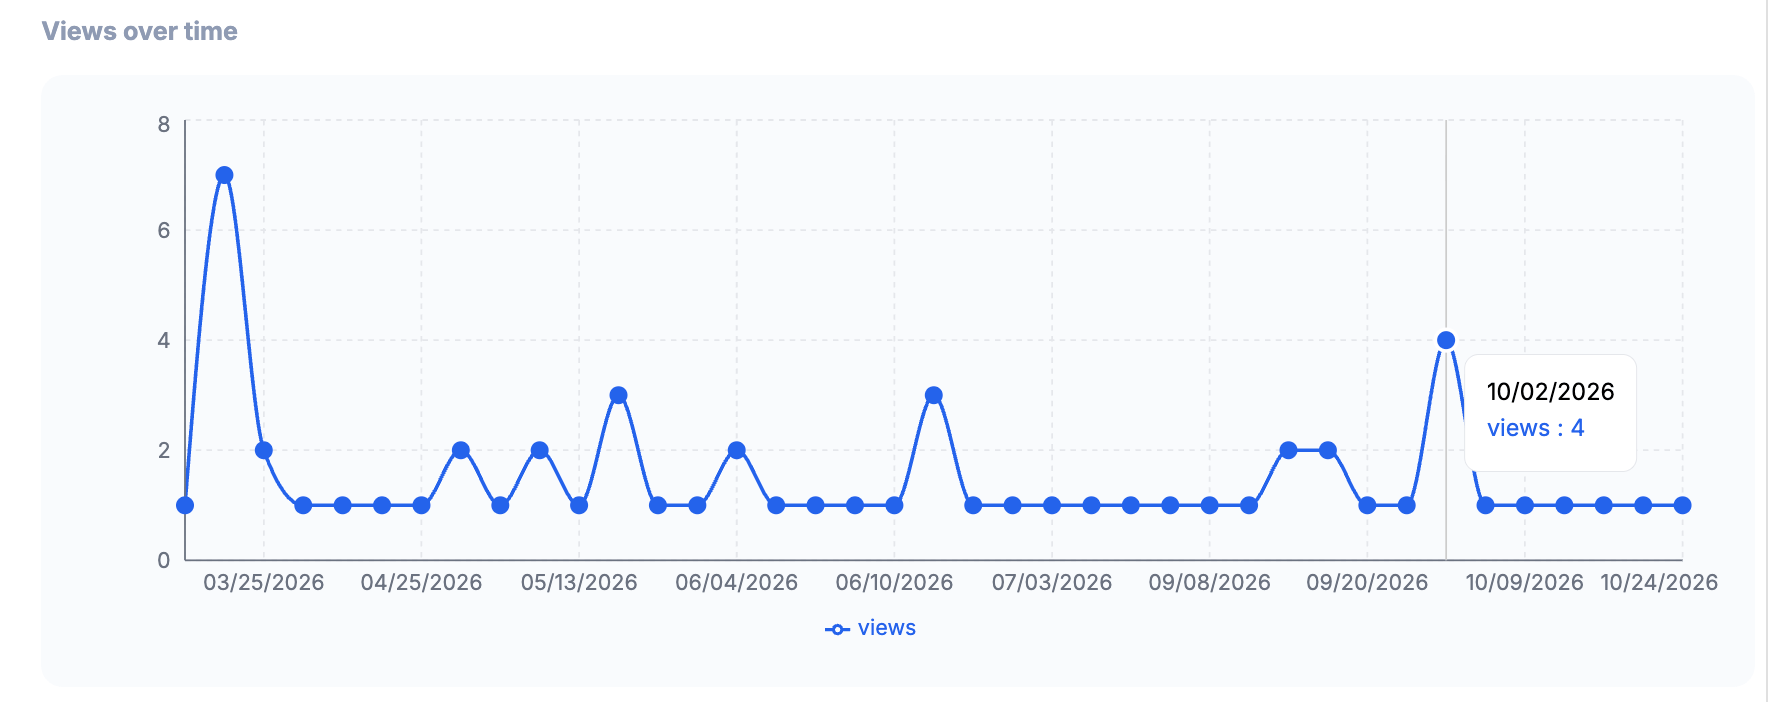
Views Over Time
Traffic Flow
Where They Came From
The domains visitors were on before opening the Demo. Named referrers show the domain only, not the specific page or link. Direct means no referring domain was recorded. This happens when:- The visitor typed the URL or used a bookmark
- The visitor clicked a link in an email (most email clients don’t pass referrer information)
- The link was set up not to share referrer data
- The visitor’s browser or privacy settings blocked it
Feedback Submissions Tab
Individual responses to this Demo’s feedback survey, newest first. The tab label shows the total count, like “Feedback Submissions (12).”- Each row shows when the response was submitted and its feedback score: X/100 if a score was recorded, or a dash if not
- Click any row to expand it and read the full response to every survey question
- Optional questions left blank show as “(no response)”
- Ranking questions show as a numbered list
Reading the Data Together
A single metric rarely tells the whole story. These are common patterns, what they usually mean, and where to look next. Patterns are only meaningful with enough traffic. With a handful of views, one or two viewers can swing any percentage, so look at the raw counts before drawing conclusions.High views, low feature progress
Viewers start the Demo but leave early. The opening isn’t hooking them, or the Demo feels too long.Check: Highest Drop-off Points in Demo Depth. Drop-off in the first few steps points to the opening. Drop-off spread across all steps points to length.
High feature progress, low sentiment
Viewers finish most of the Demo but rate it poorly. It holds their attention but doesn’t deliver what it promised.Check: The Feedback Submissions tab for specifics. If your survey has no open-ended question, add one.
High return visitor rate
Viewers are coming back to confirm something, share it, or take another look. That’s usually a sign the Demo matters to a decision they’re making.Check: Nothing to fix. This is the pattern you want.
Few outbound clicks
Only a problem if the Demo should drive an action, like a signup or contact form. If viewers get far but don’t click, the CTA’s placement or wording isn’t working. For informational Demos, few clicks is normal.Check: Feature progress. High progress with few clicks points to the CTA, not the content.
High drop-off at one step
Look at the step before acting on it.
- If it asks for an action (a form, a CTA), viewers may be completing it and leaving. That’s success.
- If it’s mid-content, the step may be too long, too complex, or disconnected from the one before.
Traffic spikes, then long quiet stretches
Viewers aren’t finding the Demo on their own. Something like an email or announcement sends them, then traffic stops.Check: What happened on spike days in Views Over Time. That’s what drives your traffic.