
Opening the Featurette Panel
- Go to Reporting → Analytics & Feedback. The Content tab opens by default.
- Set your date range in the header (defaults to the last 30 days)
- Click any Featurette row to open its panel
Analytics reflect activity starting March 4, 2026. Earlier data is under Reporting → Legacy Analytics.
Terms used on this page
Terms used on this page
Session: one visit, tracked by a session ID. Most Featurette metrics are counted or averaged per session.View: a session in which the Featurette was served. One visitor shown the Featurette in two separate sessions counts as two views.Unique visitor: a distinct visitor, tracked by a browser-based identifier on the same device and browser. A different device or a private browsing window counts as a separate unique visitor.Slide: one screen of the Featurette.CTA: a button added to a slide in the Featurette editor that links to a WaveCX Demo or to a custom page or URL. Navigation buttons like Next aren’t CTAs.See the Analytics Glossary for every analytics term.
Key Metrics
The four cards at the top of the panel.| Metric | What it shows |
|---|---|
| Total Views | Sessions in which the Featurette was served during your selected range. One visitor shown it in two separate sessions counts as two views. The card also compares this to the equal-length period before your selected range, like ”↑ +29 vs prev period.” |
| Unique Visitors | Distinct visitors who were shown the Featurette. “100% of total” means every view came from a different visitor. Visitors are tracked by browser, so the same person on another device or in a private window counts again. |
| Completions | Sessions where the viewer reached the last slide or clicked a CTA, whichever came first. A viewer who clicks a CTA on slide 2 of 10 counts as a completion. Below it is the completion rate (completions divided by Total Views), with a comparison to the previous period, like “38% rate (↑ prev: 0%).” |
| Return Visitors | Visitors who were shown the Featurette in more than one session during your selected range. “0% return rate” is the share of Total Views that came from return sessions. |
Highest Drop-off Points
Slides ranked by drop-off rate: the percentage of viewers who reached a slide but didn’t continue to the next one. For example, “Slide 1: 59%” means 59% of viewers who saw slide 1 left before slide 2.- The list is sorted by drop-off rate, not slide order
- The last slide isn’t listed, since there’s no next slide to continue to
- Each percentage is based only on viewers who reached that slide, so the list won’t add up to 100%
Intent Signals
Behaviors that suggest the Featurette was relevant enough to act on. This section only appears after at least one CTA click in your selected range.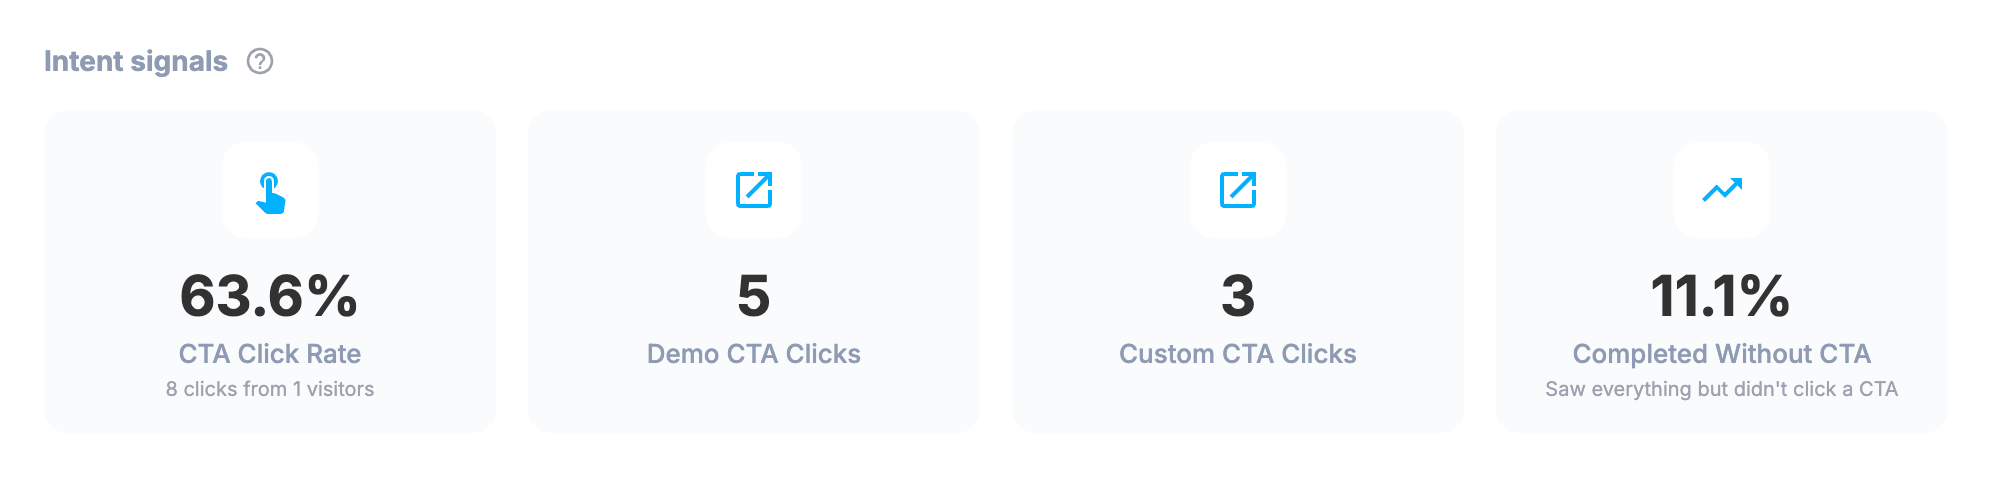
CTA Click Rate
How often viewers click the CTA buttons added to the Featurette’s slides. Clicks on Next and other navigation buttons don’t count. Below it, the panel shows the clicks and visitors behind the rate, like “4 clicks from 29 visitors.”
Completed Without CTA
The approximate share of completed sessions where the viewer reached the last slide without clicking a CTA button. It’s calculated as completions minus CTA clicks, divided by completions, so it’s an estimate rather than an exact count.A high rate means viewers are finishing but not acting. Only CTA buttons added to slides count, not Next or other navigation.
Demo CTA Clicks
Total clicks on CTA buttons that link to a WaveCX Demo. This counts clicks, not sessions, so one viewer clicking twice adds two. Only appears when there’s at least one click.
Custom CTA Clicks
Total clicks on CTA buttons that link to a custom page or URL. Only appears when there’s at least one click. Compare it with Demo CTA Clicks to see which kind your audience responds to.
Slide Performance
A breakdown for each slide. Use the slide tabs (Slide 1, Slide 2, and so on) to switch between slides. Each slide shows:Views: sessions that reached this slide. Viewers move through slides in order, so each slide has the same number of views as the one before it, or fewer. A big drop between two slides means the earlier slide isn’t pulling viewers forward.CTAs: clicks on each CTA button on this slide, with counts. Clicks on Next and other navigation buttons aren’t included.
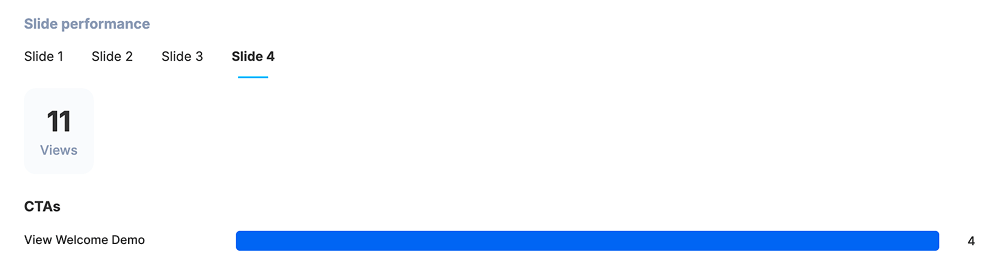

“No CTAs on this slide” means no slide-level CTA buttons were added in the Featurette editor. It doesn’t check for other clickable elements, like links or buttons in the slide’s content. Clicks on those can still show up in Intent Signals and CTA & Click Activity even when every slide says “No CTAs.”
Reception Quality
How viewers respond when the Featurette first appears. Each viewer either engages, dismisses it, or defers it, so the rates add up to 100%. This section only appears after at least one viewer has dismissed or deferred the Featurette, and a rate with no activity isn’t shown. For example, with no dismissals, there’s no Dismiss Rate card.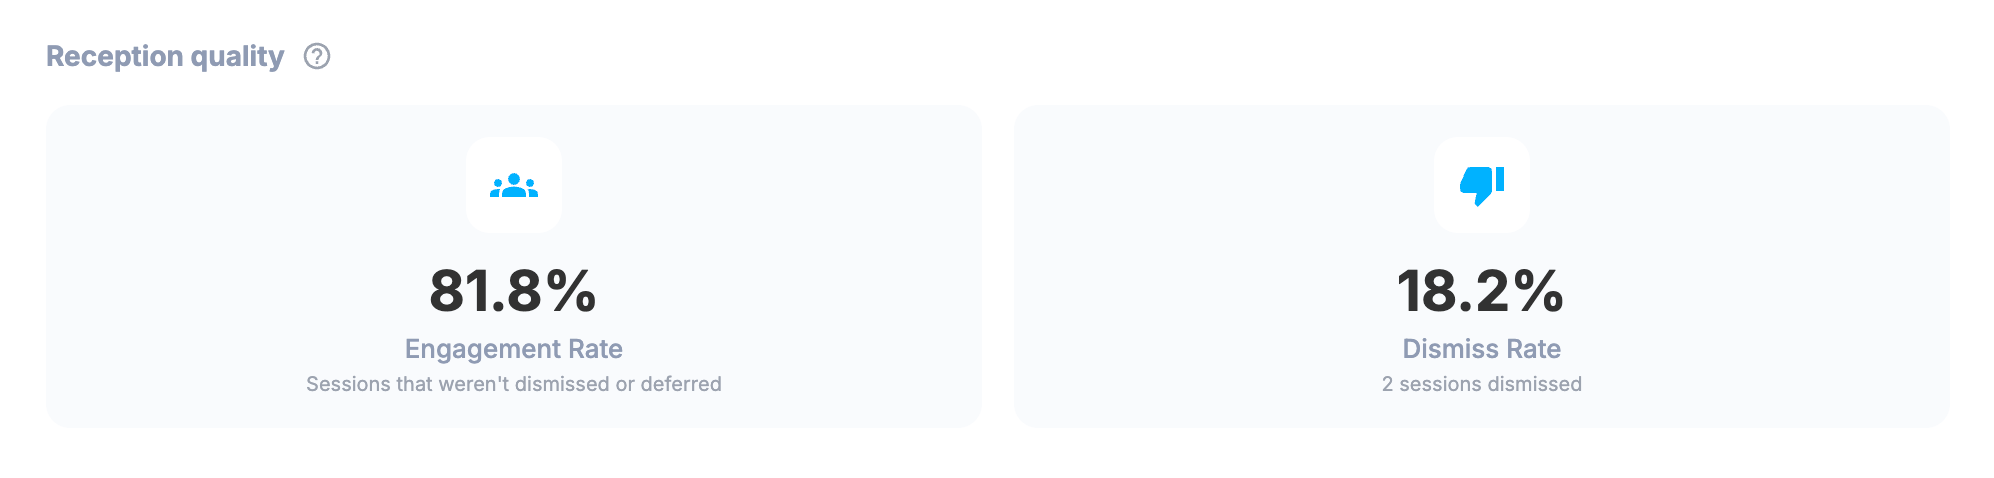
Engagement Rate
Sessions where the viewer didn’t dismiss or defer the Featurette. These viewers continued into the content, though not all of them clicked a CTA or reached the last slide.
Dismiss Rate
Sessions where the viewer chose to never see the Featurette again. It’s permanent: that viewer won’t be shown this Featurette again.
View Later Rate
Sessions where the viewer chose to see the Featurette later, shown with the count, like “3 sessions deferred.” Unlike a dismissal, these viewers haven’t opted out.
The dismiss and view later buttons can be relabeled in the admin. If your dismiss button says something like “Got it” or “All set,” a high Dismiss Rate may mean viewers got what they needed, not that they rejected the Featurette.
CTA & Click Activity
The most-clicked buttons in the Featurette, listed by the text on each button and ranked by click count.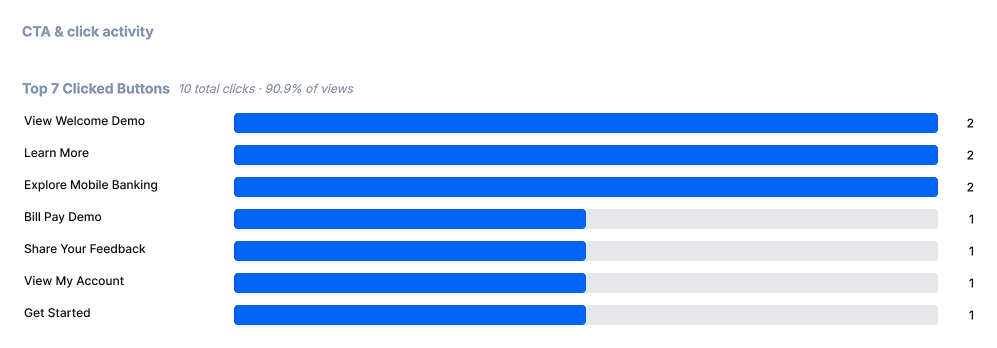
Global Actions
How many times viewers clicked each of the Featurette’s two built-in buttons: the one that hides it permanently and the one that defers it. Each card shows your button’s label, like “Don’t Show Again” or “Remind Me Later.”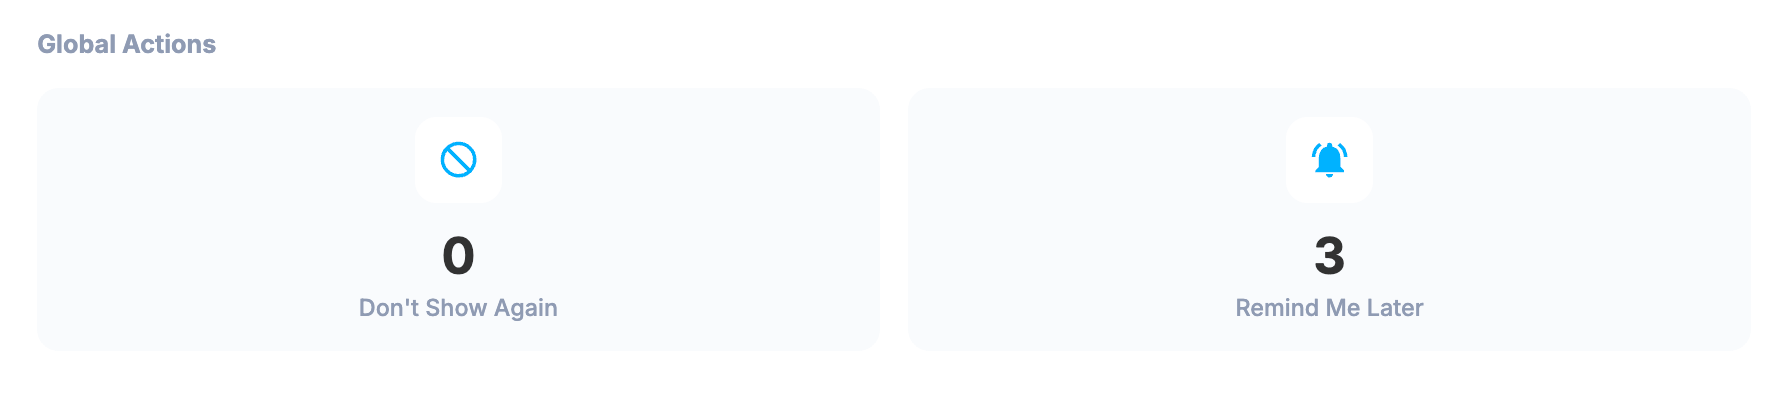
These are the counts behind Dismiss Rate and View Later Rate in Reception Quality.
Views Over Time
A line chart of how many times the Featurette was served each day in your selected range. Hover over any point to see that day’s count. The daily counts add up to Total Views.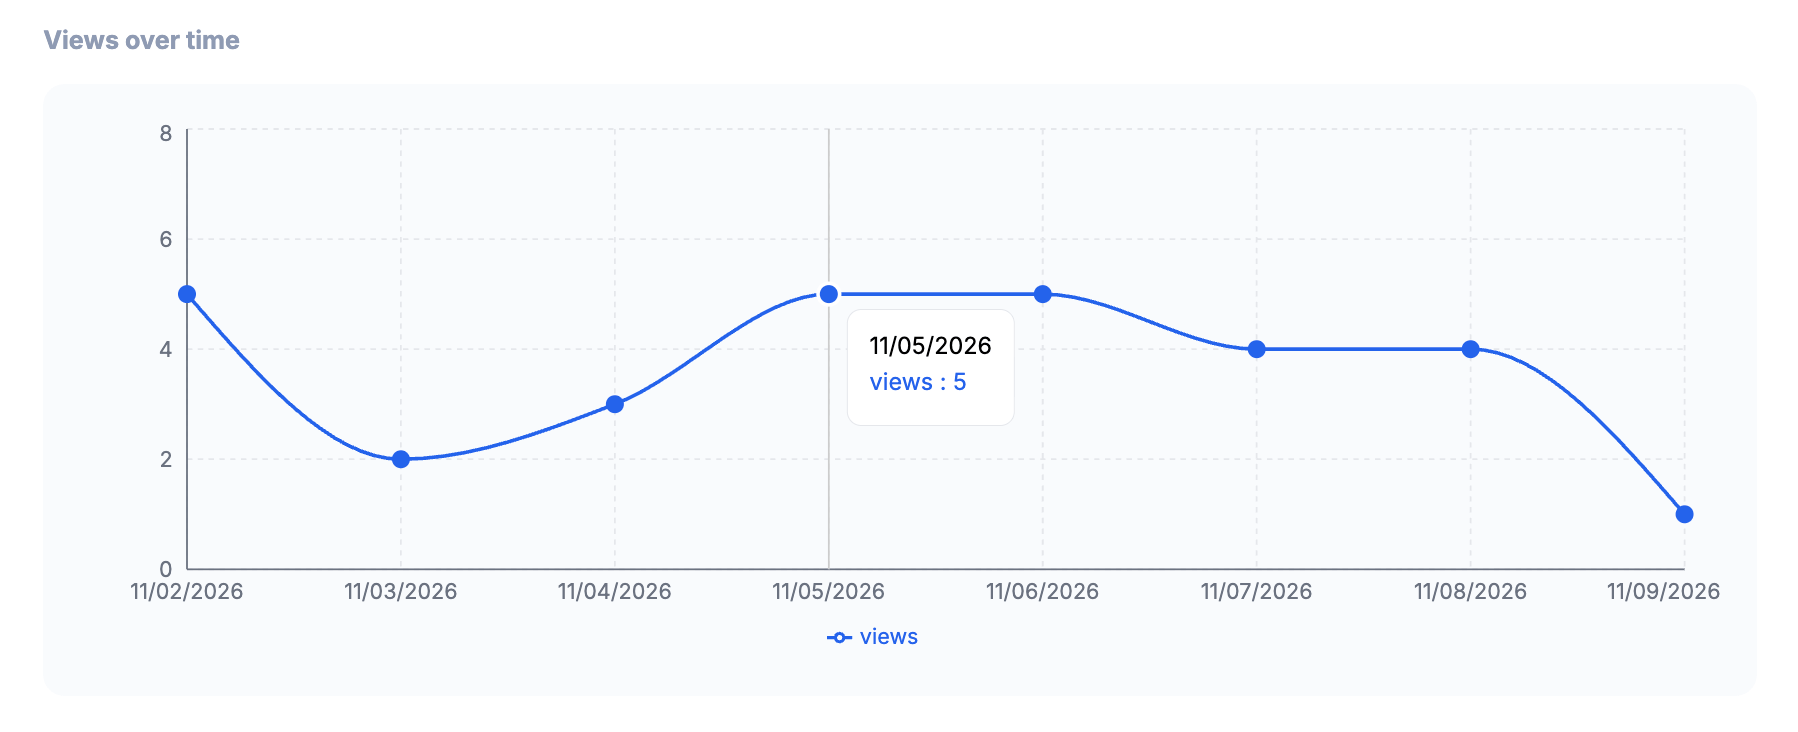
Traffic Flow
Where They Came From
The domains visitors were on before the page where this Featurette appeared. Named referrers show the domain only, not the specific page or link. Direct means no referring domain was recorded. This happens when:- The visitor typed the URL or used a bookmark
- The visitor clicked a link in an email (most email clients don’t pass referrer information)
- The link was set up not to share referrer data
- The visitor’s browser or privacy settings blocked it
Reading the Data Together
A single metric rarely tells the whole story. These are common patterns, what they usually mean, and where to look next.Patterns are only meaningful with enough traffic. With a handful of views, one or two viewers can swing any percentage, so look at the raw counts before drawing conclusions.
High views, low CTA Click Rate
Viewers see the Featurette but don’t act on it.Check: Reception Quality. A high Engagement Rate means viewers are going into the content but not converting, which points to the CTA’s wording, placement, or destination. A low Engagement Rate with a high Dismiss Rate means the Featurette isn’t connecting with the audience it’s shown to.
High Dismiss Rate
Viewers are opting out for good. This is the most important signal to act on, because dismissed viewers won’t see the Featurette again.Check: The Featurette’s targeting conditions. It may be reaching the wrong audience, appearing at a bad moment, or showing too often. If your dismiss button is labeled something like “Got it,” a high rate may be fine.
High View Later Rate
Viewers are interested but the timing is wrong.Check: Where the Featurette appears in the visitor’s flow. It works best at a natural pause, not in the middle of a task.
High completions, few CTA clicks
Viewers finish the Featurette but don’t act at the end.Check: The last slide in Slide Performance. If it shows “No CTAs on this slide,” there’s no CTA button on that slide for viewers to click. If it has CTAs with low clicks, try changing their wording or placement. If CTAs on earlier slides are also low, viewers may not find the destination relevant.
High drop-off at one slide
Look at that slide before acting on it.
- If it has a CTA, viewers may be clicking it and leaving. That’s success.
- If it’s content only, the slide may be too long, too dense, or disconnected from the one before.