- Overview
- Events
Overview
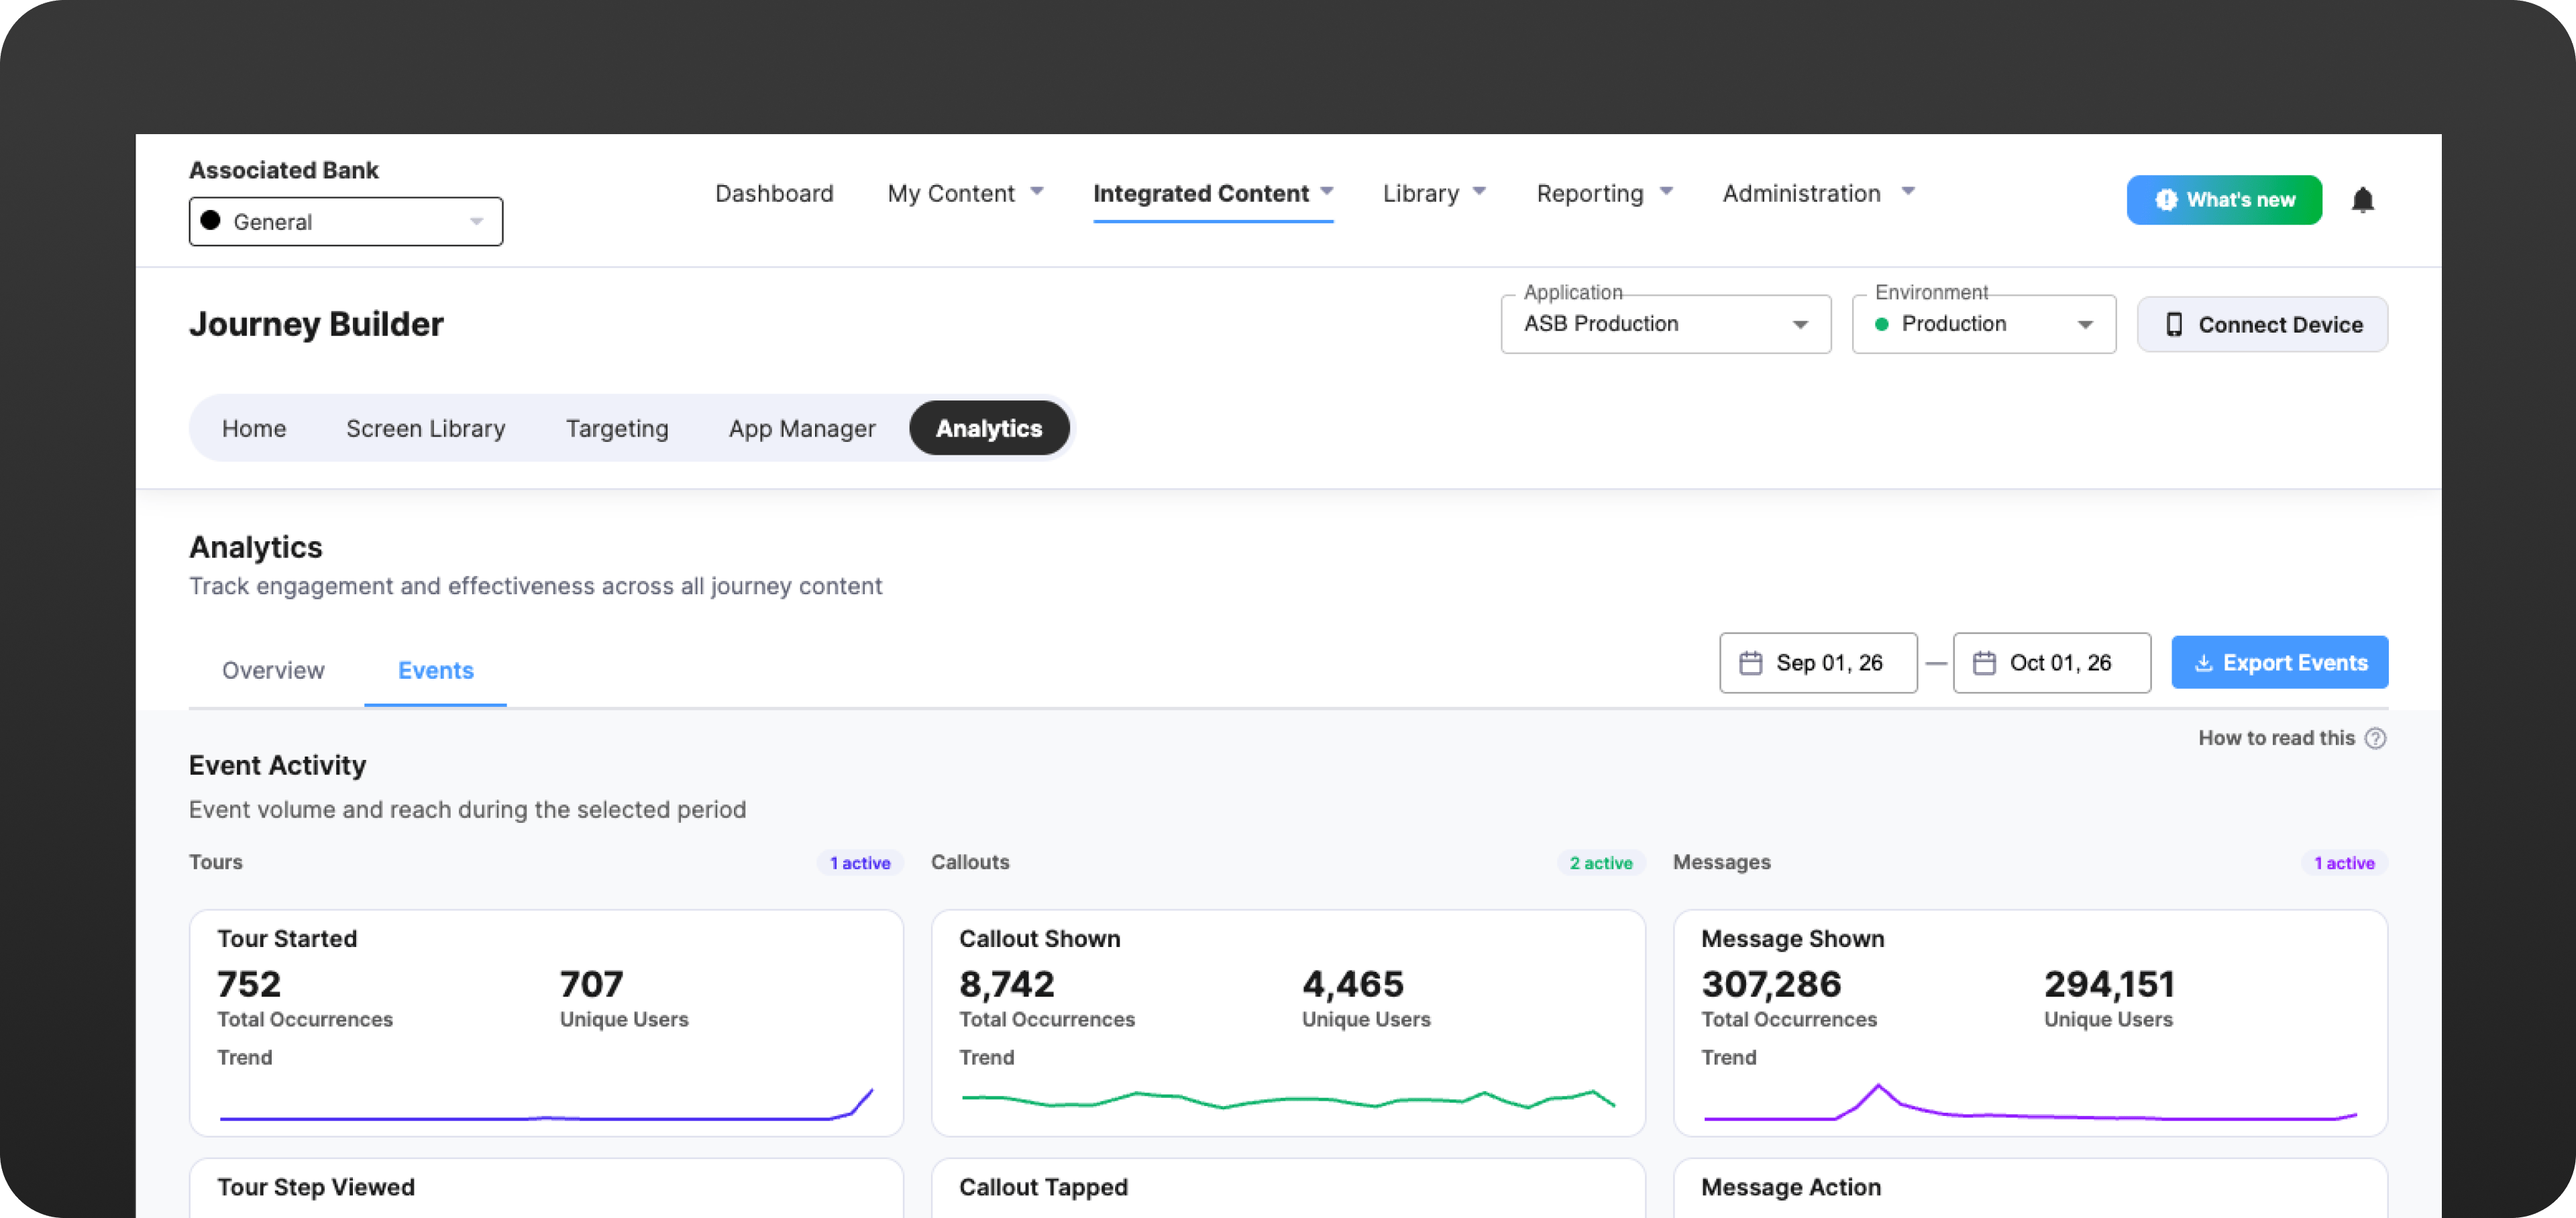
The Overview tab lets you explore user events, volume and reach during selected date ranges. The table is broken into three groups (Tours, Callouts, Messages), each showing how many are currently active.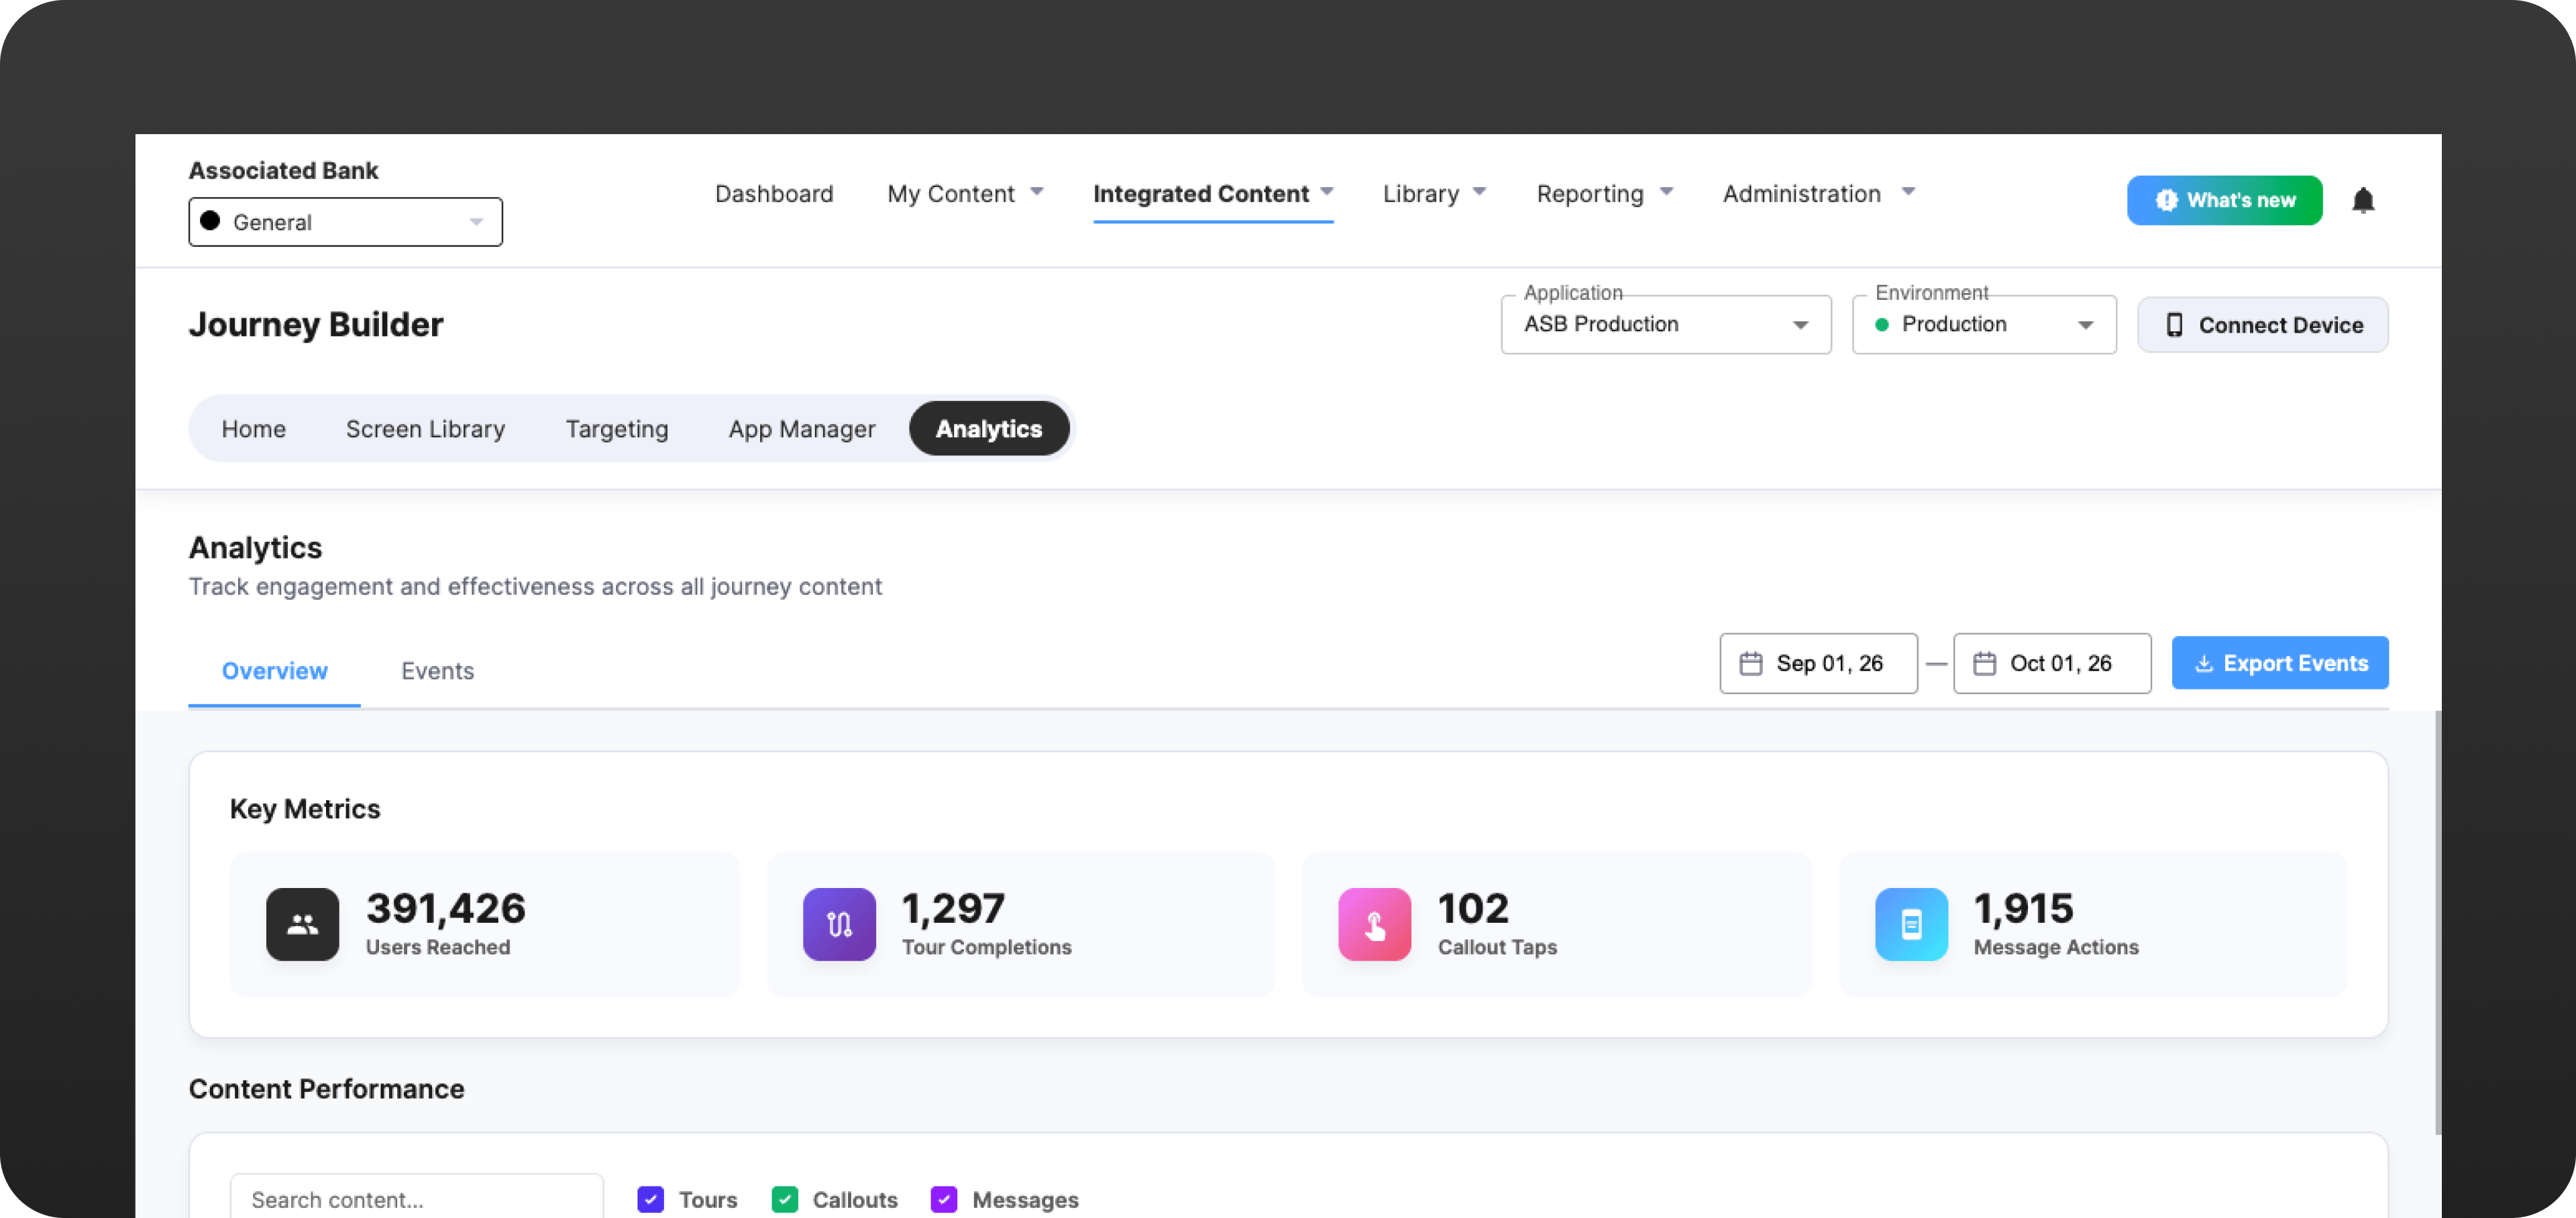
Key Metrics
Summarizes performance across all your Tours, Callouts, and Messages.Users Reached
Tour Completions
Callout Taps
Message Actions
Content Performance Table
A searchable, filterable table of every piece of content (filter by Tours / Callouts / Messages). Columns: Content, Type, Status, Views, Engagement, Unique Users.| Area | Is this column filterable |
|---|---|
| Content | Yes |
| Type | Yes |
| Status | Yes |
| Views | Yes |
| Engagement | Yes |
| Unique User | No |
Individual Analytics
Select a Tour, Callout, or Message from the table to drill into them.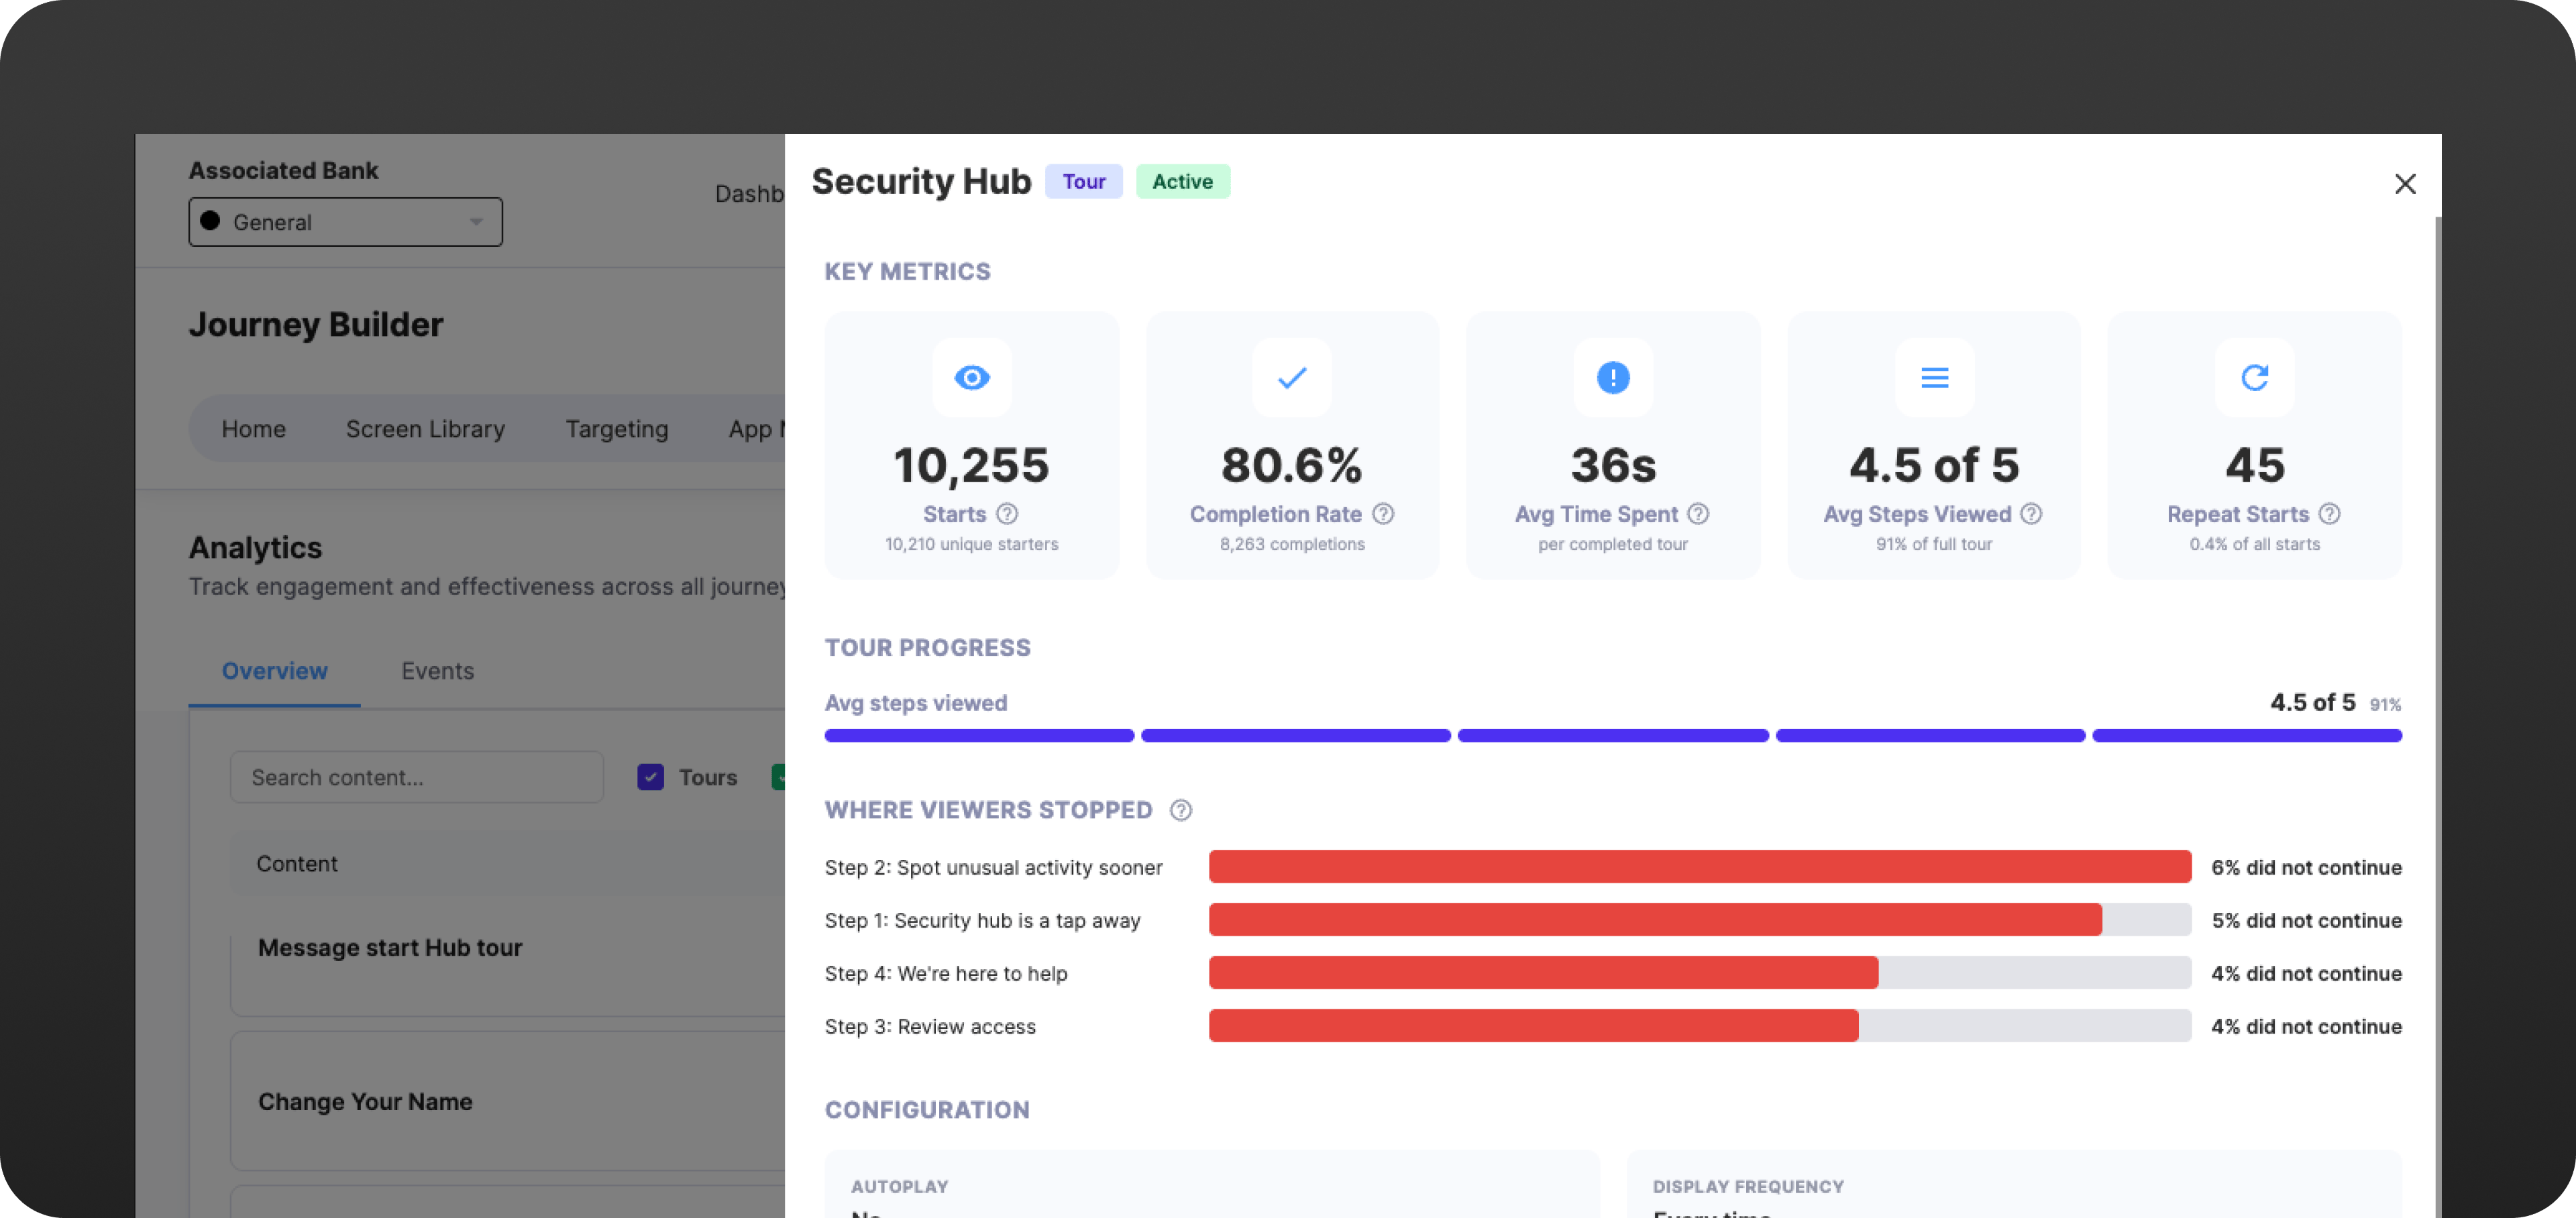
Tours
Key Metrics: Starts, Completion Rate, Avg Time Spent, Avg Steps Viewed, and Repeat Starts.Additional insights include a breakdown of Tour Progress (avg steps viewed, Configuration (autoplay, display frequency), Structure (total steps, how many are interactive), and a full step-by-step list showing which specific element each step is anchored to.
Callouts
**Key Metrics: **Impressions, Taps, and Median Time to TapAdditional insights include Action on ap (e.g. “Opens tooltip”), Configuration (target element + screen, display type, position, animation), Audience, and History (created/last updated, with who made the change).
Messages
**Key Metrics: **Impressions and Action RateAdditional insights include CTA breakdown (which specific action was taken vs. no action taken, with counts for each), Configuration (trigger + screen, display frequency, auto-dismiss, backdrop behavior, and an active date range), and Audience, shown as named segment chips when targeting is applied.